| ANAESTHESIA PEARLS | |||||||
|


| When you see beyond monitors.......... | ||||||||||||||||||||||||||||
 |
||||||||||||||||||||||||||||
|
Lesson 1: Pulse Photoplethysmography |
||||||||||||||||||||||||||||
| Beyond the Calculation of Arterial Oxygen Saturation and Heart Rate | ||||||||||||||||||||||||||||
| The pulse oximeter is a standard monitor in anaesthesia and intensive care. In addition to monitoring arterial oxygen saturation, the pulse oximeter displays the Photoplethysmographic wave form of the signal. What does the waveform mean? | ||||||||||||||||||||||||||||
 |
||||||||||||||||||||||||||||
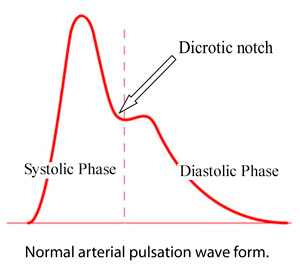
| The ascending limb of the pulse wave up to dicrotic notch ie anocrotic wave indicates the systolic phase(Left ventricle contractility) and the descending limb ie dicrotic wave indicates diastolic phase(Vascular resistance-Arteriole diameter). | ||||||||||||||||||||||||||||
| The dicrotic notch indicates the closure of the aortic valve. | ||||||||||||||||||||||||||||
| So whenever the diastolic pressure is high(↑SVR) the aortic valve closes early and the dicrotic notch is at higher level and when the diastolic pressure is low(↓SVR) the aortic valve closes late and the dicrotic notch is at lower level. | ||||||||||||||||||||||||||||
| The obervation of beat to beat variability of pulse waveform gives an insight in to the haemodynamic changes during anaesthesia. | ||||||||||||||||||||||||||||
| In this article I will outline both of the literature and what I have found during my investigations, and experimentally. | ||||||||||||||||||||||||||||
| Pulse Oximeter Waveform Amplitude | ||||||||||||||||||||||||||||
| One of the more useful plethysmographic features is the waveform amplitude: | ||||||||||||||||||||||||||||
 |
||||||||||||||||||||||||||||
|
||||||||||||||||||||||||||||
| Factors Affecting Pulse Oximeter Waveform Amplitude | ||||||||||||||||||||||||||||
1. Increased amplitude due to vasodilatation |
||||||||||||||||||||||||||||
|
||||||||||||||||||||||||||||
| 2. Decreased amplitude due to vasoconstriction | ||||||||||||||||||||||||||||
|
||||||||||||||||||||||||||||
| In General Anaesthesia | ||||||||||||||||||||||||||||
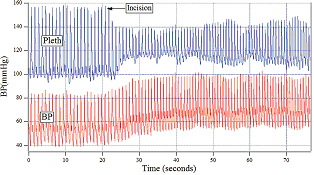
| In this case, a patient undergoing general anesthesia experiences the first surgical incision of an operative procedure. The pulse oximeter waveform is noteworthy for the sudden reduction in amplitude. This is felt to be indicative of a sudden increase in sympathetic tone causing peripheral vasoconstriction. A concomitant increase in the arterial blood pressure (BP) supports this explanation. | ||||||||||||||||||||||||||||
 |
||||||||||||||||||||||||||||
| Source: Kirk H. Shelley, MD, PhD: Photoplethysmography: Beyond the Calculation of Arterial Oxygen Saturation and Heart Rate; Anesthesia & Analgesia, Vol. 105, No. 6, December 2007. | ||||||||||||||||||||||||||||
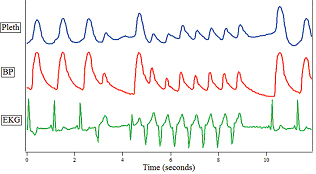
| The impact of ventricular tachycardia on the pulse oximeter waveform (Pleth), arterial pressure waveform (BP), and electrocardiogram (ECG) is illustrated in the next figure. The sudden reduction in the amplitude of the pulse oximeter waveform, combined with the typical ECG pattern, should give important warning regarding the presence of a dangerous situation. | ||||||||||||||||||||||||||||
| A beat-to-beat change of the pulse oximeter amplitude is often the first clue that the patient has developed an irregular heart rhythm. | ||||||||||||||||||||||||||||
 |
||||||||||||||||||||||||||||
| Source: Kirk H. Shelley, MD, PhD: Photoplethysmography: Beyond the Calculation of Arterial Oxygen Saturation and Heart Rate; Anesthesia & Analgesia, Vol. 105, No. 6, December 2007. | ||||||||||||||||||||||||||||
| Respiratory Variations in Pulse Oximetry Plethysmographic Waveform Amplitude to Predict Fluid Responsiveness in the Operating Room | ||||||||||||||||||||||||||||
| Recently published studies have shown that intraoperative optimization of cardiac output using volume expansion decreases postoperative morbidity and hospital stay. | ||||||||||||||||||||||||||||
| Therefore, preload dependence and fluid responsiveness assessments are of major importance during surgery. Static indicators of fluid responsiveness such as central venous pressure (CVP), pulmonary capillary wedge pressure (PCWP), or left ventricular end diastolic area index are invasive or not easily available. | ||||||||||||||||||||||||||||
| Respiratory variations in the pulse oximetry plethysmographic waveform amplitude (ΔPOP) have now been extensively studied in mechanically ventilated patients. They are strongly related to the respiratory variations in arterial pulse pressure (ΔPP) and are sensitive to changes in ventricular preload. | ||||||||||||||||||||||||||||
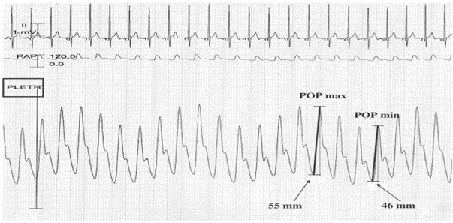
| How to calculate ΔPP and ΔPOP? | ||||||||||||||||||||||||||||
|
ΔPP (%) = 100 × ([PPmax - PPmin]/ [(PPmax + PPmin)/2]).
ΔPOP (%) = 100 × ([POPmax - POPmin]/ [(POPmax + POPmin)/2]) ΔPOP was evaluated on three consecutive respiratory cycles simultaneously with ΔPP measurements. Measurements were then averaged for statistical analysis. ΔPOP and ΔPP are strongly correlated. |
||||||||||||||||||||||||||||
 |
||||||||||||||||||||||||||||
| However, the POP waveform must be recorded and analyzed in specific conditions to be interpretable for fluid responsiveness prediction. | ||||||||||||||||||||||||||||
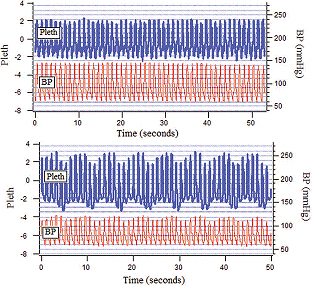
| How it works? With each positive pressure breath venous return to the heart is impeded resulting in a temporary reduction in cardiac output. As a patient becomes volume depleted, with a resulting decrease in venous pressure, positive pressure ventilation has an exaggerated impact on the arterial blood pressure. A similar effect on the pulse oximetry plethysmographic waveform has been described. The next figure demonstrates this phenomenon. | ||||||||||||||||||||||||||||
 |
||||||||||||||||||||||||||||
| Source: Kirk H. Shelley, MD, PhD: Photoplethysmography: Beyond the Calculation of Arterial Oxygen Saturation and Heart Rate; Anesthesia & Analgesia, Vol. 105, No. 6, December 2007. | ||||||||||||||||||||||||||||
| In the above figure the upper diagram shows the baseline waveforms of the patient under general anesthesia with positive pressure ventilation. The lower diagram is after a 1000 mL blood loss. The effect of blood loss on the pulse oximeter plethysmographic waveform (>ΔPOP) and arterial pressure waveform (↓amplitude, ↓BP) is apparent. | ||||||||||||||||||||||||||||
| Monitoring the respiratory variability seen in the pulse oximeter waveform may be a useful method of detecting occult hemorrhage, with its resulting hypovolemia. | ||||||||||||||||||||||||||||
| In conclusion, ΔPOP seems to be a noninvasive and widely available index of fluid responsiveness in mechanically ventilated patients during general anesthesia. | ||||||||||||||||||||||||||||
| N.B: Thanks to Kirk H. Shelley for giving permission to use his theme and images in this article. | ||||||||||||||||||||||||||||
Example: |
||||||||||||||||||||||||||||
Observations made in Spinal Anaesthesia |
||||||||||||||||||||||||||||
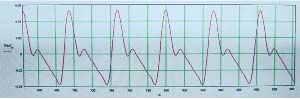
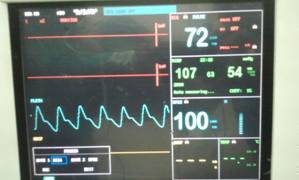
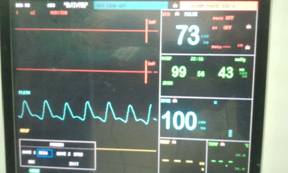
| A case of LSCS, pre-operative pulse wave form shows dicrotic notch in midway of descending limb as the BP is 107/54 mm of Hg. | ||||||||||||||||||||||||||||
 |
||||||||||||||||||||||||||||
| After spinal anaesthesia BP falls (vasodilatation) to 99/43 mm of Hg. Note that the dicrotic notch is almost near the base line. (By watching the wave form pattern we can predict the impending fall of BP) | ||||||||||||||||||||||||||||
 |
||||||||||||||||||||||||||||
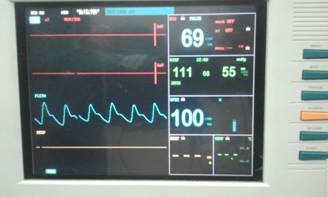
| After the IV dose of Ephedrine 6 mg (vasoconstriction), note that the dicrotic notch raised above the midway of descending limb as the BP raises to 111/55 mmHg. | ||||||||||||||||||||||||||||
 |
||||||||||||||||||||||||||||
| For example if the BP is 100/50, the dicrotic notch will be in the midway of descending limb. | ||||||||||||||||||||||||||||
| If the diastolic pressure is > 50% of systolic pressure, dicrotic notch will be above the midway mark. If the diastolic pressure is < 50% of systolic pressure, the dicrotic notch will be below the midway mark and even touches the base line.(observation) | ||||||||||||||||||||||||||||
| The above demonstrated example should be taken with caution as it happened in few cases and further study is needed. | ||||||||||||||||||||||||||||
| Tips: The pulse oximeter may not be picking up signals if the patient is in shock or in cold extremities. In this case a digital block of the finger can solve the problem by producing vasodilatation and effective capillary pulsation. | ||||||||||||||||||||||||||||
Main references are; |
||||||||||||||||||||||||||||
| 1. Kirk H. Shelley: Photoplethysmography: Beyond the Calculation of Arterial Oxygen Saturation and Heart Rate; Anesth Analg December 2007 105:S31-S36; | ||||||||||||||||||||||||||||
| 2. Cannesson, Maxime M.D. et all: Respiratory Variations in Pulse Oximetry Plethysmographic Waveform Amplitude to Predict Fluid Responsiveness in the Operating Room; Anesthesiology: June 2007 - Volume 106 - Issue 6 - pp 1105-1111 | ||||||||||||||||||||||||||||
Others: |
||||||||||||||||||||||||||||
| 1. Cannesson M, Besnard C, Durand PG, Bohe J, Jacques D: Relation between respiratory variations in pulse oximetry plethysmographic waveform amplitude and arterial pulse pressure in ventilated patients. Crit Care 2005; 9:R562–8 | ||||||||||||||||||||||||||||
Further Ref: |
||||||||||||||||||||||||||||
| 1. Grocott MPW, Mythen MG, Gan TJ: Perioperative fluid management and clinical outcomes in adults. Anesth Analg 2005; 100:1093–106 | ||||||||||||||||||||||||||||
| 2. Shelley KH, Awad AA, Stout RG, Silverman DG: The use of joint time frequency analysis to quantify the effect of ventilation on the pulse oximeter waveform. J Clin Monit Comput 2006; 20:81–7 | ||||||||||||||||||||||||||||
| 3. Shelley KH, Jablonka DH, Awad AA, Stout RG, Rezkanna H, Silverman DG: What is the best site for measuring the effect of ventilation on the pulse oximeter waveform? Anesth Analg 2006; 103:372–7 | ||||||||||||||||||||||||||||
| 4. Natalini G, Rosano A, Franschetti ME, Fachetti P, Bernardini A: Variations in arterial blood pressure and photoplethysmography during mechanical ventilation. Anesth Analg 2006; 103:1182–8 | ||||||||||||||||||||||||||||
| 5. Solus-Biguenet H, Fleyfel M, Tavernier B, Kipnis E, Onimus J, Robin E, Lebuffe G, Decoene C, Pruvot FR, Vallet B: Non-invasive prediction of fluid responsiveness during major hepatic surgery. Br J Anaesth 2006; 97:808–16 | ||||||||||||||||||||||||||||
| 6. Cannesson M, Desebbe O, Hachemi M, Jacques D, Bastien O, Lehot JJ: Respiratory variations in pulse oximeter waveform amplitude are influenced by venous return in mechanically ventilated patients under general anaesthesia. Eur J Anaesthesiol 2007; 24:245–51 | ||||||||||||||||||||||||||||
| 7. Natalini G, Rosano A, Taranto M, Faggian B, Vittorielli E, Bernardini A:Arterial versus plethysmographic dynamic indices to test responsiveness for testing fluid administration in hypotensive patients: A clinical trial. Anesth Analg 2006; 103:1478–84 | ||||||||||||||||||||||||||||
| HB – HOW LOW CAN YOU GO? | ||||||||||||||||||||||||||||
 |
||||||||||||||||||||||||||||
| For more than five decades, a hemoglobin level of 10 g/dL and a hematocrit of 30% were generally accepted minimum levels, particularly in the surgical setting. First proposed in 1942, the "10/30" rule has become more a matter of faith than data. | ||||||||||||||||||||||||||||
| How low can you go? | ||||||||||||||||||||||||||||
| Here’s a case report on a trauma patient with a haemoglobin of 0.7 g/dL(!) yielding a hematocrit of 2.2%(!) successfully managed with balanced salt solution and plasma substitutes, i.e., hydroxyethyl starch during a 12-hour surgery to repair lacerated left axillary vessels and brachial plexus nerves until appropriately cross matched blood was available (11th Hour !). | ||||||||||||||||||||||||||||
| How the patient survived those 10 hours – crystalloids and colloids kept the patient near normovolemic, and oxygen delivery was achieved through 100% O2. The patient was 34 degrees Celsius. Anaesthesia helped lower the metabolism and oxygen demand. He did also receive some matched plasma to help him coagulate, and a great plasma expander. | ||||||||||||||||||||||||||||
| According to the formula: blood oxygen content per 100 mL = 1.34 × Hb × Sao2 + (Pao2 × 0.003), the normal blood oxygen content is approximately 20 mL/dL. In the above case the patient's blood oxygen content was 1.34 × 0.7 × 100% + (500 × 0.003) = 2.4 mL/dL. | ||||||||||||||||||||||||||||
| The main success was by maintaining a normal blood volume, 100% oxygen, hypothermia, and the use of plasma substitutes until homologous blood is available. | ||||||||||||||||||||||||||||
| Zollinger et al reported a case of massive intraoperative blood loss resulting in a nadir Hgb of 1.1 g/dL that lasted for 30 minutes, was another lowest reported Hgb level in a human. | ||||||||||||||||||||||||||||
| How low is too low? | ||||||||||||||||||||||||||||
| Clinically, at Hct levels <20%, blood oxygen transport and supply to tissues and organs are affected. Experiments with animals and humans, however, have indicated that as long as normovolemia is maintained, adequate systemic oxygenation can still occur even with a Hct as low as 5% to 10%. |
||||||||||||||||||||||||||||
| A study was conducted on 300 Jehova’s Witnesses with postoperative Hb counts of 8 g per dL or less. After trying to level the field by taking age, heart disease and APACHE II score into account, they found this relationship: | ||||||||||||||||||||||||||||
| Hb 1-2: Mortality 100%
Hb 2-3: Mortality 54% Hb 3-4: Mortality 27% Hb 4-5: Mortality 34% Hb 5-6: Mortality 9% Hb 7-8: Mortality 0% |
||||||||||||||||||||||||||||
| Individuals with very low Hb concentrations often do not die quickly. Another retrospective study on Jehova’s Witnesses who died with a Hb concentration 6 g/dL or less found that there appears to be a potential time window between the day from their lowest Hb to death. |
||||||||||||||||||||||||||||
| Individuals with a Hb level of 2.0 g/dL or less had on median 1.0 (interquartile range, 0.5-1.5) day from their lowest Hb to death while individuals with their lowest Hb ranging between 4.1 and 5.0 g/dL had on median 11 (interquartile range, 1-23) days from their lowest Hb to death. | ||||||||||||||||||||||||||||
| There appears to be a potential time window where transfusion medicine physicians can intervene. It was not a surprising finding, but interesting to get an idea of where the cut-off is. Below 5 g/dL is not where you want to be. And above 7 g/dL is looking really good. | ||||||||||||||||||||||||||||
| Still it is contradicted by Samir M Fakhry and Paola Fata and suggests transfusion in the critically ill patient without active ischemic heart disease should generally be withheld until the hemoglobin level falls to 7 g/dl. | ||||||||||||||||||||||||||||
Main Ref: |
||||||||||||||||||||||||||||
| 1. JianQiang Dai et all Intraoperative management of extreme hemodilution in a patient with a severed axillary artery, A & A November 2010 vol. 111 no. 5 1204-1206 | ||||||||||||||||||||||||||||
| 2. Carson, J. L., Noveck, H., Berlin, J. A. and Gould, S. A. (2002), Mortality and morbidity in patients with very low postoperative Hb levels who decline blood transfusion. Transfusion, 42: 812–818. | ||||||||||||||||||||||||||||
| 3. Tobian, A. A.R., Ness, P. M., Noveck, H. and Carson, J. L. (2009), Time course and etiology of death in patients with severe anemia. Transfusion, 49: 1395–1399. | ||||||||||||||||||||||||||||
| 4. Samir M Fakhry and Paola Fata; How low is too low? Cardiac risks with anemia: Critical Care, Volume 8. | ||||||||||||||||||||||||||||
| 5. Anemia in Critical Care: Etiology, Treatment and Prevention: Volume 8 Supplement 2 | ||||||||||||||||||||||||||||
Others: |
||||||||||||||||||||||||||||
| 1. Zollinger A, Hager P, Singer T, Friedl HP, Pasch T, Spahn DR. Extreme hemodilution due to massive blood loss in tumor surgery. Anesthesiology 1997;87:985–7 | ||||||||||||||||||||||||||||
| 2. Weiskopf RB, Viele MK,Feiner J, Kelley S, Lieberman J, Noorani M, Leung JM, Fisher DM, Murray WR, Toy P, Moore MA . Human cardiovascular and metabolic response to acute, severe isovolemic anemia. JAMA 1998;279:217–21 | ||||||||||||||||||||||||||||
| 3. Van Woerkens EC, Trouwborst A, Duncker DJ, Koning MM, Boomsma F, Verdouw PD. Catecholamines and regional hemodynamics during isovolemic hemodilution in anesthetized pigs. J Appl Physiol 1992;72:760–9 | ||||||||||||||||||||||||||||
| 4. Lieberman JA, Weiskopf RB, Kelley SD, Feiner J, Noorani M, Leung J, Toy P, Viele M. Critical oxygen delivery in conscious humans is less than 7.3 ml O2 × kg(−1) × min(−1). Anesthesiology 2000;92:407–13 | ||||||||||||||||||||||||||||
| When you see beyond monitors.......... | ||||||||||||||||||||||||||||
| Lesson 2: Blood Pressure Monitoring...... | ||||||||||||||||||||||||||||
| Basic physiology | ||||||||||||||||||||||||||||
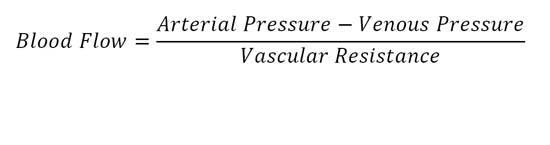
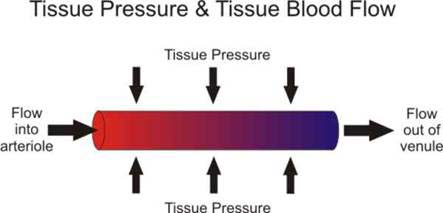
| According to Poiseuilles Law, flow in a vessel determined by pressure difference, radius & length of the vessel and the viscosity of the fluid. | ||||||||||||||||||||||||||||
| F = ΔP.r4.𝝅 / n.L(8) Poiseuilles Law F = Blood flow, ΔP = Pressure (ΔBP), r4 = Radius of blood vessel, n = Viscosity of blood L = Length |
||||||||||||||||||||||||||||
| So, blood pressure ΔBP = F.L.n/r4 | ||||||||||||||||||||||||||||
| ie BP is directly proportional to F –flow(CO), length of the vessels( Pulmonry pressure < Systemic pressure) and viscosity of blood and indirectly proportional to radius of vessel. The flow of blood in to an organ (perfusion pressure) depends on |
||||||||||||||||||||||||||||
|
||||||||||||||||||||||||||||
 |
||||||||||||||||||||||||||||
| Tissue pressures in some organs | ||||||||||||||||||||||||||||
| Intracranial pressure = 5-13 mmHg Renal intracapsular pressure = 10-18 mmHg Coronary blood flow stops at 7-12 mmHg |
||||||||||||||||||||||||||||
| Which pressure is more important? | ||||||||||||||||||||||||||||
| ||||||||||||||||||||||||||||
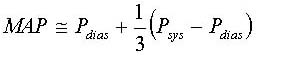
| Is it systolic or diastolic or MAP – Mean Arterial Pressure? | ||||||||||||||||||||||||||||
| The mean aortic pressure (Pmean) is the average pressure (geometric mean) during the aortic pulse cycle. As the aortic pressure pulse travels down the aorta and into distributing arteries, there are characteristic changes in the systolic and diastolic pressures, as well as in the mean pressure. The systolic pressure rises and the diastolic pressure falls, therefore the pulse pressure increases, as the pressure pulse travels away from the aorta. This occurs because of reflective waves from vessel branching, and from decreased arterial compliance (increased vessel stiffness) as the pressure pulse travels from the aorta into systemic arteries. There is only a small decline in mean arterial pressure as the pressure pulse travels down distributing arteries due to the relatively low resistance of large distributing arteries. |
||||||||||||||||||||||||||||
|
||||||||||||||||||||||||||||
 |
||||||||||||||||||||||||||||
| In nutshell : | ||||||||||||||||||||||||||||
| 1. The measured systolic BP in radial is 20mmHg higher than central aorta. So in case of shock peripheral pulse is higher than central and gives a false sense of security. | ||||||||||||||||||||||||||||
| 2. Mean Arterial Blood Pressure (MAP) | ||||||||||||||||||||||||||||
| ||||||||||||||||||||||||||||
| 3. Lowest MAP without hypoperfusion | ||||||||||||||||||||||||||||
| ||||||||||||||||||||||||||||
|
||||||||||||||||||||||||||||
| |
||||||||||||||||||||||||||||
|
||||||||||||||||||||||||||||
| Which is more accurate? | ||||||||||||||||||||||||||||
| In a clinical review, NIBP tended to be higher than radial IABP during periods of hypotension and lower than IABP during periods of hypertension. Thin and long radial artery make the systolic pressure higher during HTN Brachial Artery (Cuff) bigger closer to heart makes BP higher during hypotension. BETTER TOGETHER! |
||||||||||||||||||||||||||||
Ref: |
||||||||||||||||||||||||||||
| 1. Anaesthesia and hypotension by G.M. Woerlee: | ||||||||||||||||||||||||||||
| 2. Cardiovascular Physiology Concepts: Richard E. Klabunde, PhD | ||||||||||||||||||||||||||||
| 3. Cerebral hemodynamics during cerebral ischemia induced by acute hypotension. Frank A. Finnerty, R., Lloyd Witkin, and Joseph F. Fazekas | ||||||||||||||||||||||||||||
| 4. Acute controlled hypotension and EEG in patients with hypertension and cerebrovascular disease. P. HARMSEN, J. KJERULFF, AND E. SKINH0J. J. Neurol. Neurosurg. Psychiat., 1971. 34, 300-307 | ||||||||||||||||||||||||||||
| 5. Invasive and Concomitant Noninvasive Intraoperative Blood Pressure Monitoring: Observed Differences in Measurements and Associated Therapeutic Interventions:Anesthesiology: November 2011 - Volume 115 - Issue 5 - p 973–978 | ||||||||||||||||||||||||||||
| When you see beyond monitors.......... | ||||||||||||||||||||||||||||
| Lesson 3: Venous Oximetry – The concept of SvO2 and ScvO2 | ||||||||||||||||||||||||||||
 |
||||||||||||||||||||||||||||
| Why venous oximetry? | ||||||||||||||||||||||||||||
| ||||||||||||||||||||||||||||
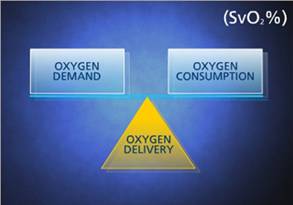
| Oxygen balance is necessary to sustain life. SvO2 is the "watchdog" of this balance and is often called the "fifth vital sign." When monitored, it serves as an early trouble indicator and can help clinicians adjust therapies. | ||||||||||||||||||||||||||||
| Unfortunately, normal values in blood pressure, central venous pressure, heart rate, and blood gases do not rule out tissue hypoxia or imbalances between whole-body oxygen supply and demand. | ||||||||||||||||||||||||||||
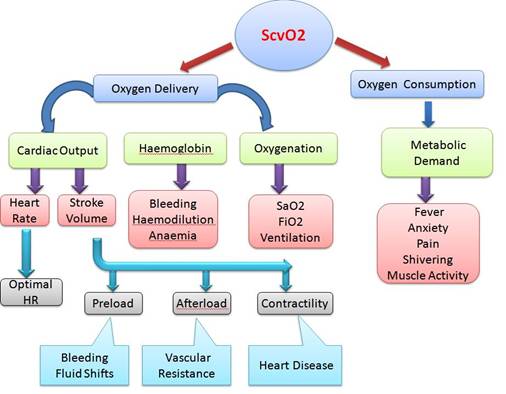
| Mixed venous(SvO2) and central venous oxygen saturations(ScvO2) reflect the balance between oxygen requirement and oxygen delivery, and thus may be used to assess the adequacy of tissue oxygenation. | ||||||||||||||||||||||||||||
| Venous oximetry allows the critical estimation of the global oxygen (O2) supply-demand ratio and can be gained from mixed (SvO2) and central venous blood (ScvO2). | ||||||||||||||||||||||||||||
| ||||||||||||||||||||||||||||
| Pulmonary artery catheterization allows obtaining true mixed venous oxygen saturation (SvO2) while measuring central venous oxygen saturation (ScvO2) via central venous catheter reflects principally the degree of oxygen extraction from the brain and the upper part of the body. | ||||||||||||||||||||||||||||
| Normal Physiology | ||||||||||||||||||||||||||||
 |
||||||||||||||||||||||||||||
 |
||||||||||||||||||||||||||||
| The normal range for SvO2, which reflects the balance between systemic oxygen delivery (DO2) and demands, is about 75%. | ||||||||||||||||||||||||||||
| A decrease in SvO2 and ScvO2 represents an increased metabolic stress, either DO2 does not increase in such a way to cover an increased VO2, or DO2 drops because of decrease in either arterial O2 content, cardiac output, or both. The magnitude of the decrease indicates the extent to which the physiological reserves are stressed. | ||||||||||||||||||||||||||||
| Limits of mixed venous oxygen saturation | ||||||||||||||||||||||||||||
| ||||||||||||||||||||||||||||
| Venous O2 saturations differ among several organ systems since they extract different amounts of O2. ScvO2 is usually less than SvO2 by about 2–3% because the lower body extracts less O2 than the upper body making inferior vena caval O2 saturation higher. | ||||||||||||||||||||||||||||
 |
||||||||||||||||||||||||||||
| The difference between the absolute value of ScvO2 and SvO2 changes under conditions of shock. | ||||||||||||||||||||||||||||
| In septic shock, ScvO2 often exceeds SvO2 by about 8%. | ||||||||||||||||||||||||||||
| During cardiogenic or hypovolemic shock mesenteric and renal blood flow decreases followed by an increase in O2 extraction in these organs. In septic shock, regional O2 consumption of the gastrointestinal tract and hence regional O2 extraction increases despite elevated regional blood flows. On the other hand, cerebral blood flow is maintained over some period in shock. This would cause a delayed drop of ScvO2 in comparison to SvO2 | ||||||||||||||||||||||||||||
| Clinical conditions and their effects on O2 delivery and O2 consumption and on venous oximetry | ||||||||||||||||||||||||||||
| ||||||||||||||||||||||||||||
| Limitations | ||||||||||||||||||||||||||||
| Venous oximetry can reflect the adequacy of tissue oxygenation only if the tissue is still capable of extracting O2. In the case of arteriovenous shunting on the microcirculatory level or cell death, SvO2 and ScvO2 may not decrease or even show elevated values despite severe tissue hypoxia. As demonstrated in patients after prolonged cardiac arrest, venous hyperoxia with an ScvO2 higher than 80% is indicative of impaired oxygen use. | ||||||||||||||||||
| Conclusion | ||||||||||||||||||
| ||||||||||||||||||
| ScvO2 > 70% | ||||||||||||||||||
| SvO2 > 65% | ||||||||||||||||||
Ref: |
||||||||||||||||||
| 1. M. R. Pinsky • L. Brochard • J. Mancebo; Applied Physiology in Intensive Care Medicine, Springer-Verlag Berlin Heidelberg 2006 |
||||||||||||||||||
| 2. Reinhart K (1989) Monitoring O2 transport and tissue oxygenation in critically ill patients. In: Reinhart K, Eyrich K (ed) Clinical aspects of O2 transport and tissue oxygenation. Springer, Berlin Heidelberg New York, pp 195–211 |
||||||||||||||||||
| 3. Rivers EP, Rady MY, Martin GB, Fenn NM, Smithline HA, Alexander ME, Nowak RM (1992) Venous hyperoxia after cardiac arrest. Characterization of a defect in systemic oxygen utilization. Chest 102:1787–1793 |
||||||||||||||||||
| 4. Transcutaneous Regional Venous Oximetry: A Feasibility Study |
||||||||||||||||||
| 5. Cerebral Monitoring: Jugular Venous Oximetry |
||||||||||||||||||
| 6. The value of venous oximetry. |
||||||||||||||||||
| 7. Incidence of low central venous oxygen saturation during unplanned admissions in a multidisciplinary intensive care unit: an observational study. Critical Care 2007, 11:R2 |
||||||||||||||||||